HTTP Probes: monitor an intranet, a public site or an API and raise incidents
One of our customers' most common needs is simple: quickly detect a service that is down (intranet, public website, API endpoint). This can be achieved through basic detection ("does the website return content with a 200 status code?") or through more advanced checks. For this, we have built configurable HTTP probes, where you can specify:
- the HTTP method (
GET,POST,PUT,PATCH,DELETE,HEAD,OPTIONS) - the expected response code (
200,201, ...) - custom headers (e.g. an API key, a Bearer token, ...)
- a request payload
- green/yellow/red status logic
- incident-raising configuration per status
The goal is not simply to display a red dot, but to raise the right incident, with the right level of information (priority, tags, incident data).
What a probe actually covers
Each probe is built on a few core fields:
- A name: to clearly identify what is being monitored
- A URL: the target to check
- A frequency: 5, 15, 30 minutes or 1 hour (depending on your plan)
- A maximum number of attempts: consecutive tries used to evaluate the green/yellow/red status
This foundation makes it possible to monitor:
- a corporate intranet,
- a public-facing website,
- or an internal/external API
Advanced HTTP: not just GET
The probe engine supports the following verbs:
GETPOSTPUTPATCHDELETEHEADOPTIONS
You can also provide a payload (a request body). This makes it possible to verify real-world scenarios:
- a classic health endpoint checked via GET
- or an endpoint that only responds correctly when given a specific payload
Custom headers
You can add arbitrary headers, for example:
Authorization: Bearer <token>X-API-Key: <api-key>X-Tenant: <tenant-id>
Useful for monitoring non-public or multi-tenant endpoints.
Non-public endpoints (private intranet, internal APIs, ...)
Do you also need to monitor private websites and internal APIs or tools (not publicly exposed)? Astry probes use a set of fixed source IP addresses (visible directly in the Probes documentation panel on your account). You can therefore allowlist Astry's IPs to query your services, ensuring checks work correctly without exposing your services to the public.
HTTP success criterion
Each probe defines an expected response code.
For example:
200on a health endpoint (this is the default)- or
204on a specific route
Status logic: green / yellow / red
When a probe queries a target, if the target does not return the expected result, the probe may retry after a short delay. Based on the results of the attempts, the probe derives a status for the target:
- Green: the target returned the expected result on the first try
- Yellow: after one or more failures, the target eventually returned the expected result
- Red: all attempts failed
This logic is important because it distinguishes between:
- a clear outage (red)
- a partial or intermittent degradation (yellow)
Incident-raising configuration (the key point)
For each abnormal status (yellow, red), you can configure an incident to be raised and specify:
- its priority
- its description
- its tags
Why this matters
- a yellow status can trigger a low-priority incident indicating degradation
- a red status can trigger a critical incident indicating a full outage
- each raised incident carries business context via its description and tags
In short: you go from a raw technical alert to an actionable operational incident.
Monitoring view
The probe detail view shows:
- the HTTP method
- the expected status code
- headers & payload (if defined)
- attempt history with time filters (last hour, last day, 7 days, 30 days)
- average response time, uptime, number of attempts
- incidents raised in the history
- status/incident configuration
This allows you to quickly link, in both directions (probe → incident and incident → probe):
- What was checked
- What failed
- And which incident was raised
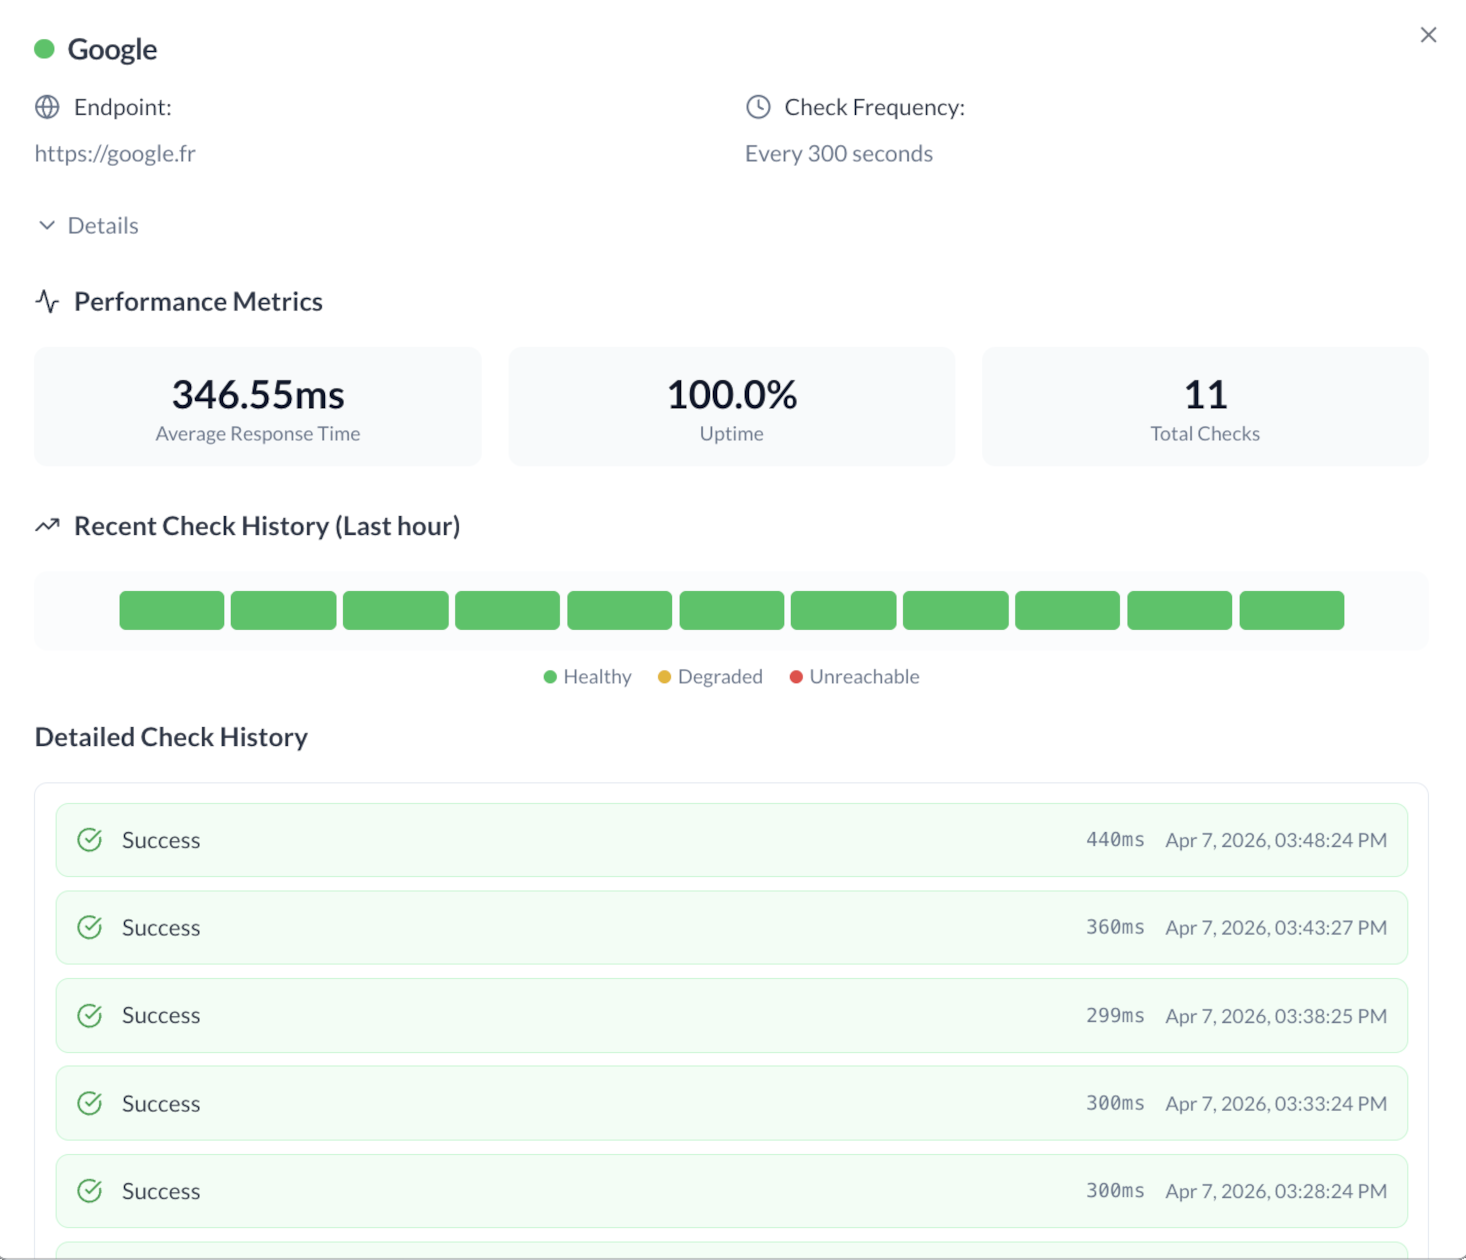 Example probe detail view
Overview in the dashboard
Probes are also visible from the supervision dashboard, which provides a consolidated view of your services' health at a glance, without having to navigate into each probe individually.
Simple configuration example
Use case: monitoring an authenticated intranet.
- name:
Intranet - status - endpoint:
https://intranet.example.com/api/status - method:
GET - expected status code:
200 - header:
Authorization: Bearer <token> - frequency:
900seconds (15 min) - max tries:
3 - yellow incident: enabled, priority 3, description "Intranet partially degraded"
- red incident: enabled, priority 2, description "Intranet unavailable"
Configuration best practices
- use an explicit probe name
- monitor an endpoint representative of actual usage
- only enable yellow-status incident raising if you genuinely need to track that case (it is relatively rare)
- tag incidents to facilitate sorting and correlation
Summary
This HTTP probe system makes it possible to:
- detect potentially down services (intranet, public websites, APIs)
- go beyond a simple GET (full HTTP verbs, headers, payload)
- turn a status into a structured incident
The real value is here: technical monitoring natively connected to actionable incident management.
Interested? Feel free to try Astry for free.